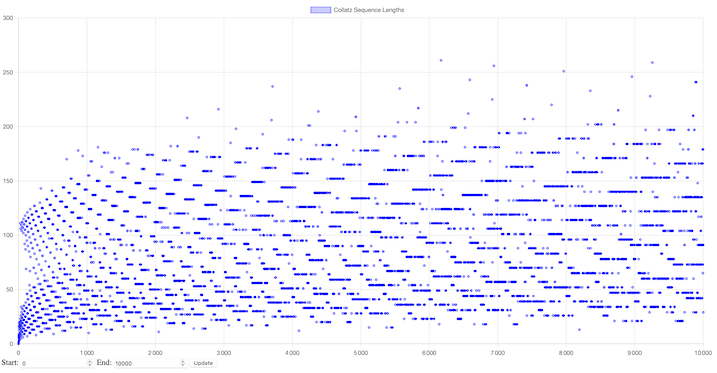
Collatz Conjecture Visualization
Prompt engineering time !
Answer
I'd be happy to help you create a program that displays the Collatz conjecture graphically! Here's a breakdown of what you can do, along with some questions to clarify your preferences:
Data and Visualization:
Starting points: Specify which starting points or range of starting points you want to visualize. Do you want to focus on a specific number, a range (e.g., all odd numbers less than 1000), or allow user input?
Data collection: Decide how you'll generate the Collatz sequence data for each starting point. Will you calculate each step iteratively or use a recursive approach?
Visualization type: Choose how you want to represent the sequences graphically. Options include:
Plot: Line plot showing the sequence progression (starting value on the x-axis, each step's value on the y-axis). You could have multiple lines on the same plot for different starting points.
Histogram: Shows the distribution of sequence lengths for a range of starting points.
Scatter plot: Plots starting points on one axis and corresponding sequence lengths on the other.
Animation: Animates the sequence progression for a single starting point or multiple ones.
Programming Language and Tools:
Language: Consider your familiarity with different languages (Python, JavaScript, etc.) and the available libraries that support data visualization (e.g., Matplotlib for Python, D3.js for JavaScript).
Libraries: Explore specific libraries within your chosen language that offer appropriate visualization functions.
Additional Considerations:
Performance: If visualizing many sequences or large starting values, consider optimizing your code for efficiency.
Interactivity: Do you want users to interact with the visualization (change starting points, adjust plot range)?
Customization: How much control do you want over the appearance of the visualization (colors, labels, etc.)?
By answering these questions, I can provide more tailored guidance on specific code snippets and approaches. Feel free to share your preferences and any examples you've found that you like!
Answer
JavaScript program for Collatz conjecture visualization:
Here's a JavaScript program using HTML canvas and the popular Chart.js library to create a scatter plot of Collatz sequences for numbers from 0 to 1,000,000, with adjustable range and optimized performance:
Explanation:
This code uses Chart.js to create a scatter plot with starting numbers on the x-axis and sequence lengths on the y-axis.
The
updateChartfunction is called when the user clicks the "Update" button or when the page loads.It clears the existing data and iterates through the specified range (start and end values from input fields).
For each starting number, it calculates the Collatz sequence length efficiently using a
whileloop.The calculated data is pushed into the Chart.js dataset, and the chart is updated.
The
pointRadiusis set to 2 for performance optimization when dealing with many data points.You can adjust the
backgroundColorandborderColorfor customization if needed.
Additional notes:
This code focuses on performance by:
Clearing existing data instead of adding new points on each update.
Using a simple loop for Collatz sequence calculation.
You can further optimize by using Web Workers for parallel calculations if dealing with a very large range.
Consider adding error handling for invalid input ranges.
This program provides a basic implementation that you can adapt and customize to your preferences. Feel free to explore more advanced visualization techniques and Chart.js options for further enhancements.

PS : i had to change the cdn url to make it works.
Going meta
Answer
Here's a prompt that could have been used to generate the code:
Create a web application that visualizes the Collatz conjecture for a range of starting numbers. The application should:
Display a scatter plot on a canvas element.
Allow users to specify a starting and ending range for the visualization using input fields.
Calculate the length of the Collatz sequence for each number in the chosen range.
Plot the starting number on the X-axis and the sequence length on the Y-axis.
Use Chart.js library for creating the chart.
Enable users to update the visualization by clicking a "Update" button after changing the range.
Display labels for the X and Y axes explaining their meaning.
Additional requirements:
Use descriptive variable and function names.
Add comments to explain complex parts of the code.
Ensure the code is clean and well-formatted.
This prompt captures the key functionalities and technical details of the provided code, prompting someone to develop a similar application. It also encourages good coding practices through additional requirements.